
Market Volatility, Trade Uncertainty and GDP: What We Learned in April 2025
April 2025’s market volatility and escalating trade uncertainty had a significant consequence: a contraction in the U.S. GDP. This analysis explores the interplay of these factors and what they mean for investors.
The Importance of Planning
April was one of the most volatile months in history as markets reacted to new tariff announcements. However, even though the S&P 500 fell as much as 12% during the month, the index rebounded and closed within one percent of where it started. Recent data also showed that the economy shrank slightly in the first quarter as companies stockpiled imported goods ahead of new tariffs. While bonds and international stocks were also volatile, they both contributed positively to diversified portfolios. This is yet another reminder of the importance of staying invested and diversified in times of uncertainty.
Key Market and Economic Drivers
- The S&P 500 fell 0.8% in April, the Dow Jones Industrial Average fell 3.2%, and the Nasdaq rose 0.9%. Year-to-date, the S&P 500 has declined 5.3%, the Dow 4.4%, and the Nasdaq 9.7%.
- The Bloomberg U.S. Aggregate Bond index gained 0.4% in April and is up 3.2% year-to-date. The 10-year Treasury yield ended the month at 4.16%, but was as low as 3.99% and as high as 4.49% over the month.
- The U.S. dollar index fell 4.5% to end the month at 99.5, near a three-year low.
- Bitcoin fell to $77,052 during the month, but ended at $94,581.
- The Consumer Price Index rose 2.4% in March compared to the prior year, slower than expected and the lowest reading since last September.
- Retail sales fell 0.9%, including a 1.9% decline in non-store retail sales (i.e., online shopping). The household savings rate rose slightly to 4.6% but is still below the historical average of 6.2%.
- The economy shrank slightly with GDP falling 0.3% in the first quarter, the first decline since Q1 2022. A significant increase in import activity drove this decline.
Lessons on staying invested after a volatile month
Once again, April demonstrated the importance of being prepared for market uncertainty. The month began with the White House’s April 2 tariff announcement on nearly all trading partners. These tariffs were far higher than investors had expected, leading to fears of rising inflation, a global economic slowdown, and a trade war. Stock markets reacted with the sharpest declines since the pandemic.
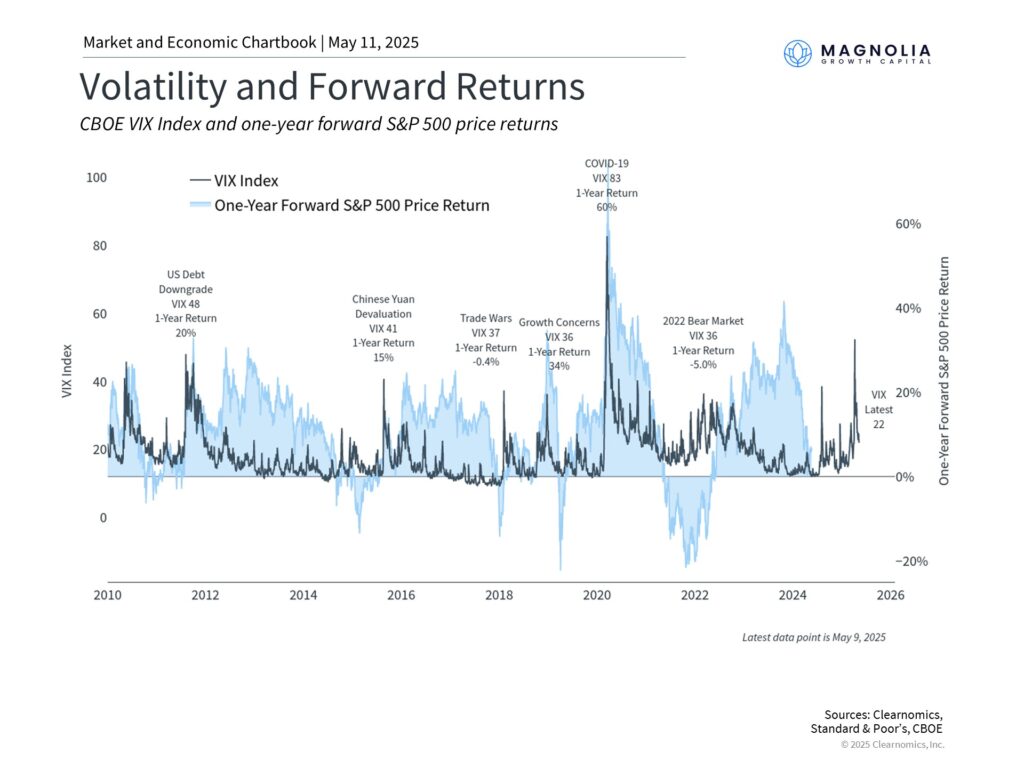
Stock market volatility jumped in April
The administration’s decision just days later to implement a 90-day pause for most countries helped fuel a market recovery. Additional exemptions on tariffs with China, including on technology products, further calmed investors’ nerves.
Despite significant swings throughout the month, major indices closed with only modest changes. Diversified portfolios also benefited from bond returns and a rally in international stocks. So, while the S&P 500 is down about 4.9% for the year with dividends, many balanced portfolios are closer to flat.
The accompanying chart shows that the VIX index, a key measure of market volatility, briefly crossed 50 for the first time since the pandemic. However, many of the largest declines during the month were followed by significant rebounds. This is a reminder that market swings can move in both directions, and trying to time these moves can often be counterproductive.
While markets have stabilized somewhat more recently, uncertainty remains and many of the drivers of April’s volatility will continue to be in focus. The situation around trade policy is still evolving, although the 90-day pause suggests that the worst-case scenarios may be less likely. Investors should expect that tariff headlines could continue to drive volatility in the near-term, even as markets adapt to the new trade landscape.
Why did GDP decline in the First Quarter?
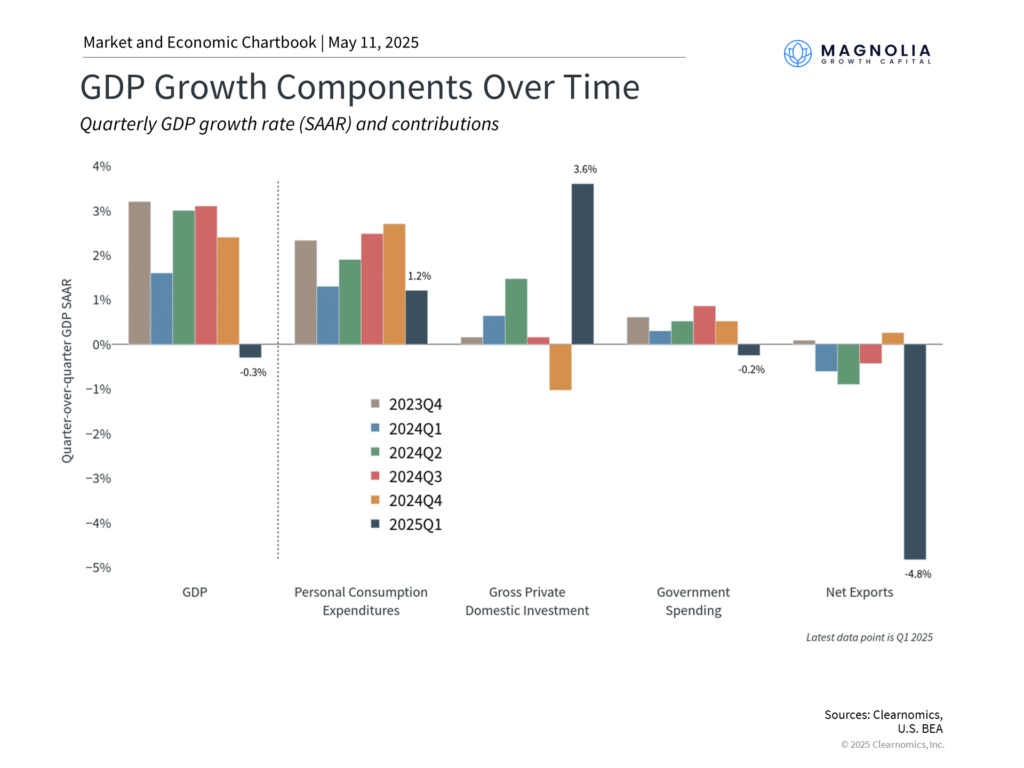
One of the key concerns among investors is whether tariffs will drive inflation higher and growth lower. The latest economic reports show that the economy shrank slightly in the first quarter, with GDP declining by 0.3% over the period, the first contraction since early 2022. GDP is calculated by summing consumption, investment, government spending, and net exports (exports minus imports). When imports increase, they reduce net exports, which in turn lowers GDP. In this case, businesses were importing more goods, likely in anticipation of tariffs making those goods more expensive in the future. Consumer spending slowed but remained positive. It’s important to note that these figures are only the first estimate of GDP and are subject to change.
As the accompanying chart shows, consumer spending has been a key driver of economic growth in recent years. The latest surveys suggest that consumers expect a rapid acceleration in prices over both the coming year and in the longer run, resulting in historically low consumer confidence. While this has not yet impacted consumer spending or inflation in a significant way, it could be an important factor in the coming months.
The mixed picture on economic growth and inflation also makes the Fed’s job more difficult. Not only does the central bank face challenging interest rate decisions in the coming months, but its independence was briefly called into question by the White House, driving further market uncertainty. At the moment, markets expect the Fed to cut rates about four times this year, possibly beginning in July.
These events also resulted in unusual bond market swings, although they ended up near where they started. The 10-year Treasury yield ended the month at 4.16%, while corporate bonds saw yields edge higher. Some investors worried about a flight from U.S. assets, especially with the U.S. dollar falling to multi-year lows.
Why Long-term Investing Matters?
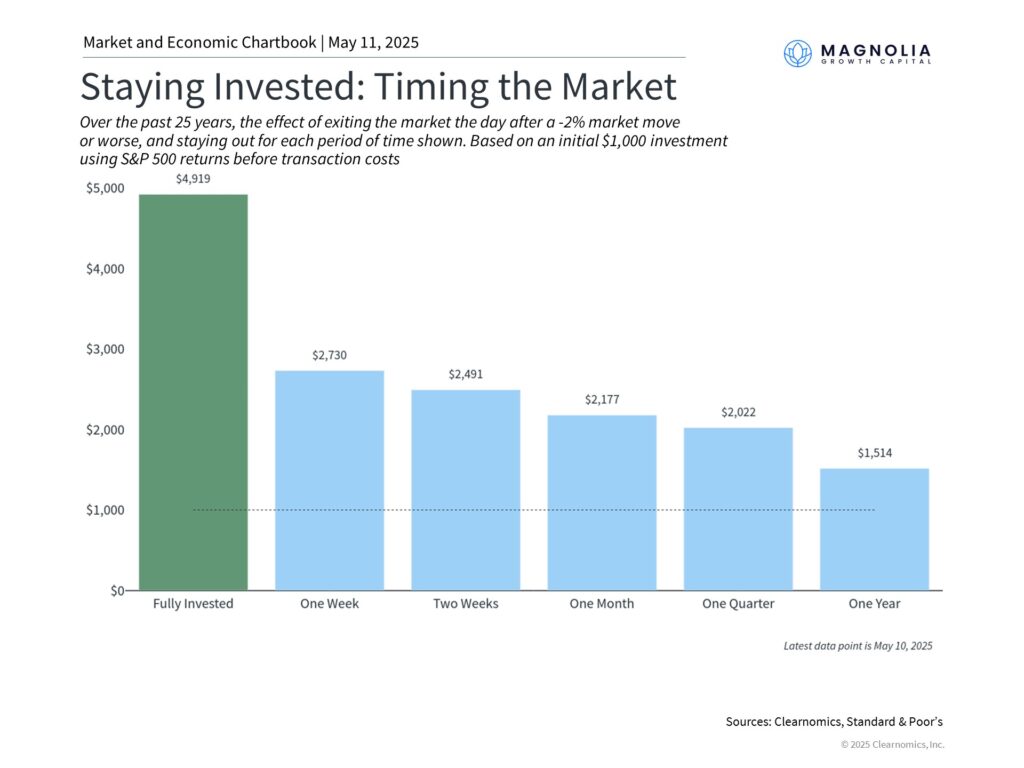
In the face of recent challenges, one investment principle remains clear: staying invested through periods of volatility has historically been an important path to long-term financial success. The accompanying chart demonstrates the potential cost of attempting to time the market every time a 2% decline (or worse) occurs. Since positive and negative days often occur at unpredictable times, exiting the market after negative days, even for a short period, can backfire. The temptation to time the market may be even greater in today’s market and economic environment.
While increased volatility can be unsettling, it’s in times like these that focusing on your financial plan, portfolio construction, and areas of opportunity is most important. Market volatility often results in attractive valuations across many asset classes, offering potential opportunities for those in search of greater diversification and balance in their portfolios. The S&P 500, for instance, has seen a significant improvement in its price-to-earnings ratio this year.
The bottom line? Market volatility in April is a reminder that short-term market swings can occur without notice. History repeatedly demonstrates that disciplined investors who focus on their long-term financial plans will be better positioned to achieve their goals.
This communication is for informational purposes only and is not intended as tax, accounting or legal advice, as an offer or solicitation of an offer to buy or sell, or as an endorsement of any company, security, fund, or other securities or non-securities offering. This communication should not be relied upon as the sole factor in an investment making decision.
Past performance is no indication of future results. Investment in securities involves significant risk and has the potential for partial or complete loss of funds invested. It should not be assumed that any recommendations made will be profitable or equal the performance noted in this publication.
The information herein is provided “AS IS” and without warranties of any kind either express or implied. To the fullest extent permissible pursuant to applicable laws, Magnolia Growth Capital LLC (referred to as “MGC”) disclaims all warranties, express or implied, including, but not limited to, implied warranties of merchantability, non-infringement, and suitability for a particular purpose.
All opinions and estimates constitute MGC’s judgement as of the date of this communication and are subject to change without notice. MGC does not warrant that the information will be free from error. The information should not be relied upon for purposes of transacting securities or other investments. Your use of the information is at your sole risk. Under no circumstances shall MGC be liable for any direct, indirect, special or consequential damages that result from the use of, or the inability to use, the information provided herein, even if MGC or a MGC authorized representative has been advised of the possibility of such damages. Information contained herein should not be considered a solicitation to buy, an offer to sell, or a recommendation of any security in any jurisdiction where such offer, solicitation, or recommendation would be unlawful or unauthorized.
 Investment strategy customization and risk management